About a month ago, Twitter opened up access to its analytics tool – until now available for advertisers only – for a larger percentage of users. There are still some restrictions, mostly around the primary language of the account, but if you’re tweeting mainly in English you can certainly go check it out. I looked around a couple of times and it shows interesting bits of data about followers and tweet impressions (including replies!). As far as I can tell, it’s restricted to the past four weeks, so I’m not sure how useful it would be for people trying to extract patterns and improve engagement. I presume advertisers have access to longer time-series and more detailed insight about followers.

Here are some of the things I noticed at first glance:
- On the first tab, the dashboard shows overall statistics about engagement with your tweets (link clicks, favorites, replies, retweets), as well the individual data about tweets in a reverse-chronological list. As expected, engagement rates are rater low, almost never exceeding 5%. And impressions are not very impressive either.

- Clicking on a tweet here will show the sources of engagement (provided there are any). Also interesting to note how quickly impressions drops off after the tweet was posted.

- On the ‘Followers’ tab, the first graph shows how their numbers evolved over time, in my case over the last two years. Nothing major happened, their number decreasing slowly from about 200 to 185 currently, which could be just an indication of Twitter cracking down on spam accounts.
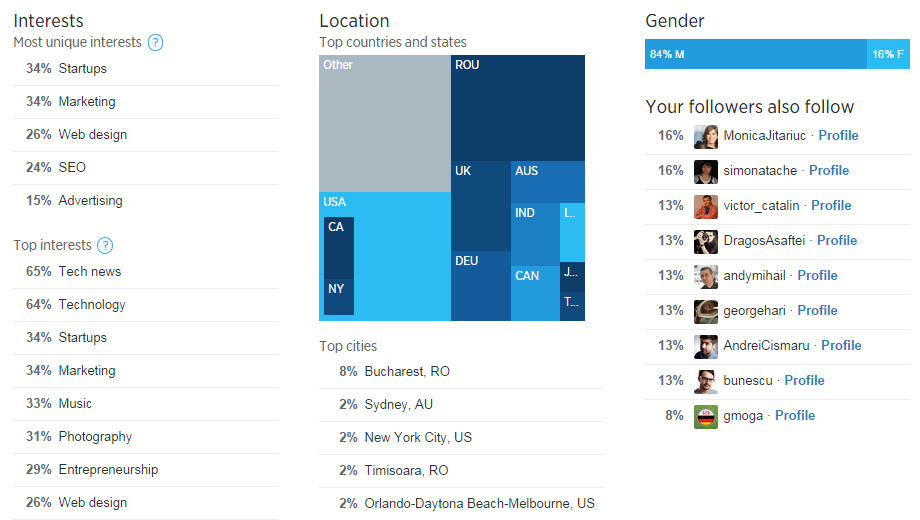
- Further down the page, the dashboard lists some demographics about followers. Most of them were just as I expected, but there were some surprises as well. Since I mostly share links about tech news, web design and related subjects, it’s no wonder these interests are at the top of the list among my followers, and that, gender-wise, the large majority are male. On the other hand, I wasn’t expecting so many of them to be from Romania (around 20% according to the dashboard), since this is my English account and I have another for more localized tweets in Romanian. And Sydney as the second city? What’s up with that?

- The tab ‘Twitter Cards’ is somewhat confusing, because the chart ‘Change over time’ shows the evolution of impressions and clicks compared to the date 28 days ago. If that was a good day, with above-average engagement, the rest of the month will look like a depressing race to the bottom. Hovering over each data point shows a more accurate picture, with absolute, rather than relative numbers. A nice, clear piece of information is the section that shows links with most clicks – this time by URL, not by tweet, so it’s also counting clicks when other people share your content. Amusingly, the last section, ‘Influencers’, reports that my secondary account is responsible for more impressions than the primary, even though it has less followers and I tweet less often.


Post a Comment